Claquos | Apply the “Buoy” Effect to your Charts
August 19, 2023 | Claquos | en

When you create a pie chart with Claquos, the script makes no special assumptions about which Object Style to apply, either to individual slices or to the entire group. It only takes control of fill colors and stroke model. That is, you can freely apply styles, effects, or other settings to your chart.
Even better, you can preset multiple effects within an object style and apply it uniformly to the group created by Claquos. This step-by-step tutorial shows you how to proceed.
I — Create your Object Style First
Before running Claquos, create an object style that will be dedicated to the resulting group. I say the resulting group, because the buoy effect we're trying to achieve uses shadows and bevels for the entire graph. That's why I called this style “BuoyFx-Group”.
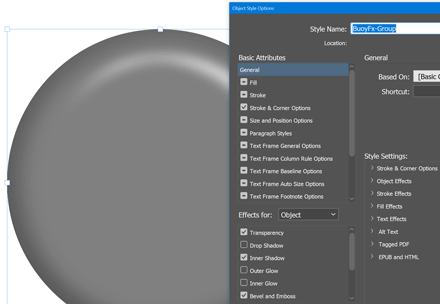
1. The first thing to do is disable all Basic Attributes, except maybe the Stroke & Corner Options if you want to control and refine these settings:
2. Optionally, in Stroke & Corner Options, adjust Join and End Cap to slightly improve the roundness of the dividing lines:
3. Select Effects for Object and set the global Transparency. Usually you just want the default, normal blending mode, with a 100% opacity:
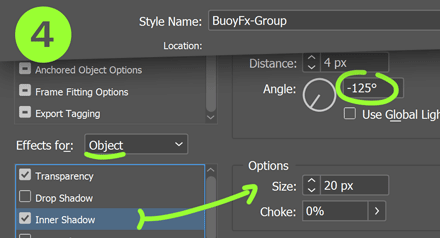
4. Still in Object mode, uncheck all effects except Inner Shadow and Bevel and Emboss. In our example inner shadows only produce a very slight fill effect (not the main effect), so keep Opacity low and adjust Angle and Size to subtly diffuse the shadow:
5. Still in Object mode, go to Bevel and Emboss. What we want here is a smooth inner bevel in Up direction. Better is to have a gray oval template available in your InDesign document while adjusting these settings, so you can control how Size, Soften, Angle and Altitude will affect the result with respect to the average dimensions of your pie charts:
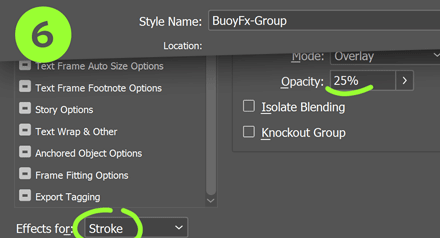
6. As the ultimate refinement, go to Effects for Stroke and disable all effects, except the Basic Blending of the global Transparency section. For my part I switch to Overlay mode and significantly reduce the opacity (25%). Thus, whatever the Stroke model selected in Claquos, the separation lines on the buoy will be less marked and will look more like slight seams:
Check the result on a typical object of the dimensions of your project:
II — Deselect the Style and Run Claquos
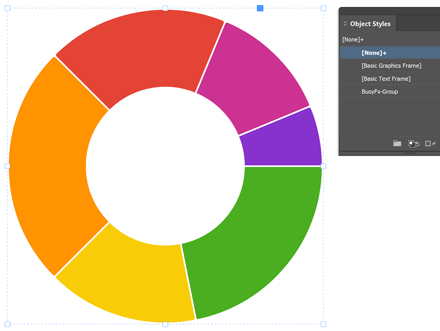
Since the “BuoyFx-Group” style we have juste created is not meant to operate on internal pies, it is not a good idea to have it applied to the original pattern that needs to be transformed by Claquos. Better is to have [None] or [Basic Graphics Frame] selected at this stage—unless you otherwise have a particular style to apply to individual pies, but this is still a distinct question. By default, the program will just maintain the style and settings possessed by the template.
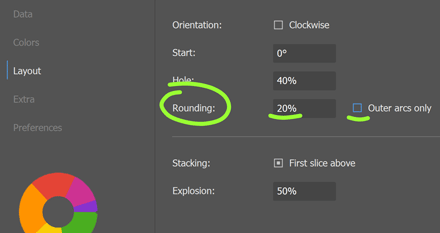
Once your data are loaded, go to the Layout panel and set Rounding to at least 20% (or maybe a little more) and uncheck “Outer arcs only”. This emphasizes the round, soft texture of the buoy. (Also, set the Hole value to 40 or 50%.)
This is what your raw pie chart might then look like:
III — Apply the Style!
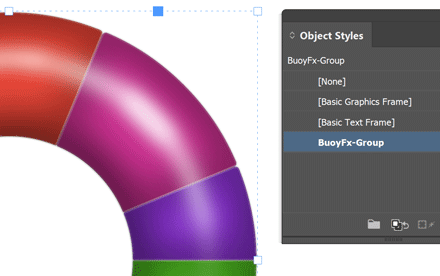
Finally, all you have to do is to keep the group selected in InDesign and apply the “BuoyFx-Group” style you have prepared:
Depending on the background you will be using behind your charts, you may need to improve the inner shadow, the altitude of the inner bevel, the blending mode of the Stroke effects, etc. In my example (on a white background) here's a zoomed-in preview showing the edge processing better:
Once you have your style perfectly tuned for your project, applying it to all of your graphics is a breeze. Remember that in order to create a distinct pie chart with new data, you only need to duplicate any existing one, select the group and run Claquos!


